
Course Prep + Stats
Course Prep + Stats is how you prepare a hole with Stracka Book data, then post the round so the numbers mean something. A scorecard tells you what you shot. This product is the shot log on the map, the stats after those shots are posted, and the debrief that points at what to work on next. It lives at strackastats.com. This site does not run checkout for it.
Jim Stracka invented the laser-scanned green-reading map in 2007. Course prep uses that same course imagery — the 31K+ course database, with 13,000+ full hyper-accurate green maps — so a planned shot sits on a real hole, not a blank diagram. More than two million physical books have been sold from the same mapping work. Stats is the other half of that loop: prepare, play, post, see the leak.
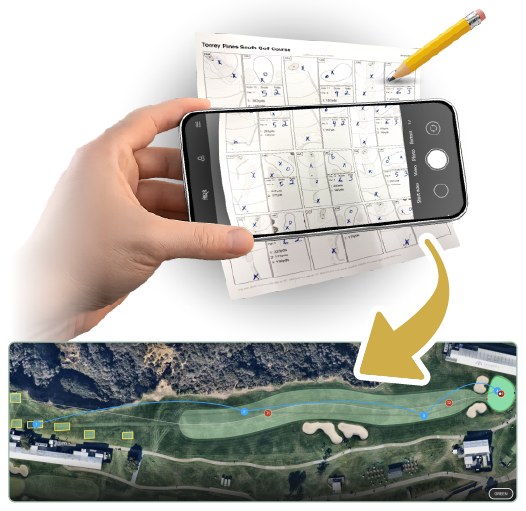
Prepare the hole on Stracka Book imagery, then post shots for strokes gained and traditional stats.
Prep the hole before you play it
Prepare for Round lets you pre-plan clubs and targets without scoring. It preloads the tee box and hole location when those are available, or you pick the tees. For each shot you choose a club, and the tool overlays your shot dispersion for that club against the landing area on Stracka imagery for that hole. At the end, a Shot Log Sheet is generated with club selections, aim targets, and projected dispersions for that area.
A Shot Log Sheet is a simple way to prepare for a future round and log shots while playing. It has a simplified graphic of each hole and green on the course, printed on one sheet of paper. You do not need a sensor or a wearable to use it. Mark the shots. Those X Marks the Shot notes convert to geolocation on our maps so Strokes Gained and traditional stats fill in after you post. Analysis is available after shots and scores are posted — not a live overlay that plays the hole for you.
This is not Putt Line + GPS. That product is the on-course green map and GPS distances. Course prep is planning and logging against the same Stracka Book data. If you still want paper in the bag for the putting surface, the book path starts at How to Order a Yardage Book and the comparison is Printed Green Book vs App.
What the stats actually are
After you post, you get traditional stats and Strokes Gained, with trend charts on the Player Dashboard. The dashboard shows rounds, holes, and shots logged; scoring average; and insights such as best distance for hitting greens and club-specific shot dispersion. You can enter a team code to share data with a coach. That is the same stack 900+ NCAA teams already sit next to in the NCAA program.
Putting stats use StrackaLine 3D green maps, so the breakdown is not only putt length. It includes the calculated break on each putt. You get putts per round, longest putt made, one-putt through four-putt-plus percentages, and a split for putts inside and outside 15 feet by slope (uphill, downhill, flat) and break (straight, left-to-right, right-to-left). Three-putt tendencies show the miss: pull or push, long or short. That is the point of logging on a real green map instead of a distance bucket alone.
Game management visualizes shot dispersions for each club overlaid on Stracka Book data. A printable GolfRank Shot Log Sheet can carry preplanned targets, clubs, and distances into the round. Coaches get a comparison view to track player trends, a date range for scoring and strokes-gained reports, and tee-box selection when they plan an event. College cost and contacts live on the NCAA page. Consumer use starts at strackastats.com.
After the round
Stats can overwhelm a useful round. The debrief is built to show what to work on, not to dump every number at once. Once shots are posted, the engine generates a Golfer Debrief Report with a practice plan from those stats, and a Loop highlight reel so a shot tracker is easy to share. You can compare stats against other players on detailed dashboards. Online events and leaderboards are a separate hub: Golf event leaderboards (StrackaCompete).
Launch-monitor and swing-analyzer feeds are not part of this product today. Logging is the shot sheet and the map, not a hardware stack. Support answers the phone. College teams also get webinars and training through the NCAA program contacts.
Open Course Prep + Stats NCAA program
Hole locations for a facility or an event sit on hole locations and pinsheets. Printed books for a shop are on wholesale book pricing. The rest of the library is on Resources.
FAQ
Do I need a sensor to track stats?
No. Print a Shot Log Sheet for the course you are playing, mark the shots, and post them. Marks convert to geolocation on Stracka maps. Analysis is available after shots and scores are posted.
What is Prepare for Round?
A planning pass with no scoring. You pick clubs and targets on Stracka imagery, see that club’s dispersion on the landing area, and print a Shot Log Sheet with those choices for the round.
What makes putting stats different here?
They sit on StrackaLine 3D green maps, so each putt has distance and calculated break, plus slope and miss tendencies — not a distance bucket alone.
Is this the GPS putting app?
No. On-course green maps and GPS are Putt Line + GPS. This hub is course prep, shot logging, and stats after you post.
Where do I start?
At strackastats.com. College teams start on the NCAA program page. strackagolf.com does not run checkout for stats.